.png "The Vested Group | NetSuite Solution Provider Partner | NetSuite Consulting | NetSuite Support")
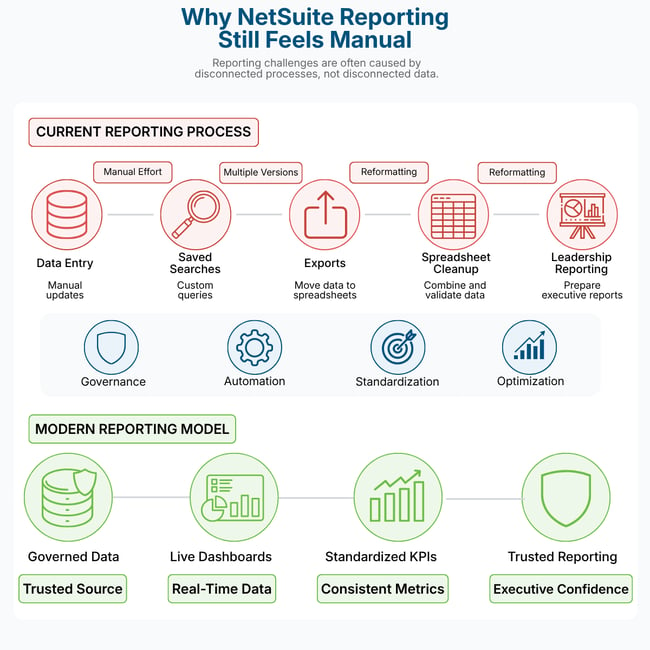
NetSuite reporting feels manual when the system's tools — saved searches, dashboards, financial reports, and SuiteAnalytics workbooks — have not been designed and maintained to match how the business actually operates. The root causes are typically inconsistent data entry, unclear or undocumented KPI definitions, reports built around outdated go-live requirements, and key business processes that happen outside the system. Fixing manual reporting requires addressing these underlying structural causes — not simply exporting data differently or rebuilding the same reports in a new format.
NetSuite reporting is one of the most common sources of frustration after implementation. Companies invest in an enterprise resource planning system with the expectation of real-time visibility, consolidated data, and leadership dashboards that refresh automatically. Yet many finance and operations teams still spend hours each week exporting data into spreadsheets, cleaning and reconciling numbers, and rebuilding reports from scratch before every leadership meeting.
This is not a niche problem. It is remarkably common across organizations of all sizes, across industries, and across NetSuite implementations of varying complexity. And it rarely gets better on its own. Understanding why manual reporting persists — and what it actually costs — is the first step toward fixing it.
The Real Business Cost of Manual Reporting
Manual reporting is easy to dismiss as an inconvenience. In practice, it carries measurable costs that compound over time.
Time Cost
Consider a finance team that spends four hours each week preparing reports for a Monday leadership meeting. Over a year, that is more than 200 hours of analyst time dedicated not to analysis, but to data assembly. At a fully loaded cost of $75 per hour, that represents over $15,000 per year in labor — for one recurring report. Most organizations run multiple reports across multiple departments, and the time cost multiplies accordingly.
Decision Latency
When reporting requires manual preparation, decisions wait on reports. A CEO who needs to understand margin trends by product line cannot act on data she does not yet have. A VP of Operations who wants to evaluate fulfillment performance by warehouse must wait for a report that will not be ready until Thursday. This decision latency is not always visible in financial statements, but it accumulates in missed opportunities, slower responses to market changes, and leadership teams that operate on information that is already days or weeks old.
Error Risk
Manual processes introduce manual errors. When a team exports data, reformats it, applies formulas, and merges it with data from other sources, every step is an opportunity for something to go wrong. A misaligned VLOOKUP, a filter applied incorrectly, or a row excluded from a sum can produce a report that looks accurate but is not. Leadership decisions made on flawed numbers can have real operational and financial consequences — and the errors are often not discovered until they create a downstream problem.
Leadership Confidence
When leadership repeatedly encounters reports that do not reconcile, numbers that differ from what was presented last quarter, or metrics that are defined differently by different departments, confidence in the data erodes. Over time, executives begin to question every number, demand multiple sources of validation, or simply stop trusting the ERP as the system of record. Restoring that confidence requires not just better reports, but a demonstrated improvement in data governance and consistency.
Manual Reporting Is Usually a Symptom
Manual reporting does not always mean NetSuite lacks capability. NetSuite includes robust reporting tools — saved searches, financial reports, dashboards, KPI scorecards, and the SuiteAnalytics workbook builder — that can surface complex data in real time. When teams are still exporting and rebuilding reports manually, the problem is rarely the tool itself.
Manual reporting is a symptom. It usually points to one or more underlying issues in reporting structure, data governance, process design, or configuration. Fixing the symptom without addressing the cause produces temporary relief. The reports improve briefly, then drift back toward manual workarounds as the underlying conditions reassert themselves.
Common Causes of Manual Reporting and How They Manifest
Inconsistent Data Entry
Reporting is only as reliable as the data it draws from. When users enter data differently — using different item classes, skipping required fields, logging expenses to incorrect accounts, or categorizing transactions inconsistently — reports based on that data will produce results that do not reflect reality. A sales report filtered by product category will miss transactions categorized incorrectly. An expense report grouped by department will combine amounts that belong in different cost centers. The analyst who receives the export must then clean and reclassify records manually before the report can be used, which reintroduces the labor the ERP was supposed to eliminate.
Unclear KPI Definitions
Many organizations discover, usually during a reporting improvement project, that different departments define the same metric differently. Revenue may mean booked revenue to sales and recognized revenue to finance. Gross margin may include or exclude certain freight costs depending on who is calculating it. Days sales outstanding may use different starting and ending date conventions. When KPI definitions are not formally agreed upon and documented, reports built by different people for different audiences will produce different numbers — even when drawing from the same system. Leadership then spends meeting time debating which number is correct rather than acting on the information.
Saved Searches That Do Not Match Business Needs
Saved searches are NetSuite's primary reporting mechanism for transactional data. When they are built during implementation to satisfy go-live requirements rather than ongoing operational needs, they quickly become outdated. A saved search built to track open purchase orders by vendor may not account for a new approval workflow introduced six months post-go- live. A revenue report built for one business model may not translate cleanly after a product line expansion. Teams work around outdated saved searches by exporting the raw data and applying their own filters in spreadsheets — effectively rebuilding the report outside the system.
Dashboards That Are Not Role-Specific
A dashboard that shows everything to everyone shows nothing useful to anyone. When a CFO, a warehouse manager, and an inside sales rep all see the same generic dashboard, none of them have the visibility they actually need. The CFO navigates away to run custom financial reports. The warehouse manager exports an open order list. The sales rep checks a spreadsheet maintained by a colleague. Role-specific dashboards require intentional design — understanding what each user needs to see at the start of the day, what decisions they make, and what alerts would be genuinely useful to them.
Processes Handled Outside NetSuite
When key business processes — approvals, project tracking, customer communications, inventory adjustments — happen outside NetSuite, the data those processes generate does not flow into the ERP. Reporting that should reflect those activities cannot, because the system of record is incomplete. Teams must manually incorporate external data to produce a complete picture, which requires ongoing maintenance and creates a persistent gap between system data and operational reality.
Reports Built Around Outdated Requirements
Business needs evolve. Product lines change, org structures shift, new revenue streams emerge, and reporting requirements that were accurate at go-live become misaligned with current operations. When reports are not reviewed and updated regularly, they drift out of alignment with the business and gradually become less useful — until teams replace them with manual alternatives that can be adjusted more easily.
Diagnosing Your Reporting Problem
Before investing time in rebuilding reports, it is worth diagnosing the actual source of reporting friction. The following questions can help identify where the problem originates.
- Which reports does your team prepare manually each month, and how long does that preparation take?
- Where does the manual work happen — in the export itself, in the cleanup, or in the combination of multiple data sources?
- Do different teams define the same KPIs differently? Has that definition ever been formally documented?
- When was the last time your key saved searches and dashboards were reviewed against current business needs?
- Are there business processes that happen outside NetSuite that should be captured in the system?
- Do users know how to use existing reports, or do they avoid them because they are confusing or unreliable?
- Does leadership trust the numbers that come out of NetSuite? If not, why not?
- Are there recurring data quality issues — missing fields, miscategorized transactions, duplicate records — that make reporting unreliable?
The answers to these questions will reveal whether the reporting problem is primarily a configuration issue, a data governance issue, a process issue, or a training issue — each of which requires a different solution.
How Data Governance Directly Impacts Reporting Quality
Data governance is the set of policies, standards, and practices that determine how data is entered, maintained, and used within a system. It is often underinvested after go-live, when attention shifts from implementation to operations. But data governance is the foundation on which reporting quality depends.
Without governance, data entry practices diverge over time. Users develop their own conventions. Fields that were mandatory at go-live get bypassed. New employees enter data according to informal guidance rather than formal standards. Each inconsistency is small on its own, but collectively they degrade the reliability of every report that depends on that data.
Strong data governance for NetSuite reporting includes documented field-level entry standards, clearly defined approval workflows that enforce data quality, regular data audits to identify and correct inconsistencies, KPI definitions that are formally agreed upon and accessible, and a process for evaluating and approving new report requests against existing standards. When governance is in place, reports become more reliable without requiring manual cleanup — because the underlying data is clean to begin with.
What Role-Based Dashboards Should Actually Show
Role-based dashboards are one of the highest-value improvements available in NetSuite, but only when they are designed around how each role actually works.
CFO Dashboard
A CFO dashboard should lead with financial position — cash balance, accounts receivable aging, accounts payable obligations, and revenue against budget. It should surface trends that require executive attention: margin compression, days sales outstanding trending upward, budget variances exceeding threshold. It should not require the CFO to navigate to separate reports to answer basic financial health questions. Every KPI on the dashboard should be directly tied to a decision the CFO makes regularly.
Operations Dashboard
An operations manager needs visibility into throughput, fulfillment status, backorder volume, and vendor performance. The dashboard should surface open purchase orders by expected receipt date, unfulfilled sales orders aging past threshold, and inventory levels for high-velocity items. It should flag exceptions — not just summary metrics — so the operations team knows where to intervene each morning without running a separate report.
Sales Dashboard
A sales dashboard should show pipeline by stage and age, quota attainment by rep, and recent closed deals. It should surface leads that have gone dormant, opportunities approaching close date, and renewal accounts that need attention. Sales leaders need forward-looking visibility, not just a summary of what has already closed.
Each of these dashboards requires a separate design conversation — not a one-size-fits-all approach. The return on that investment is immediate: users who see relevant information when they log in are more likely to use the system and trust the data it presents.
What a Reporting Improvement Project Looks Like in Practice
A reporting improvement project follows a structured sequence that begins with diagnosis and ends with governance. The first phase is discovery — inventorying all current reports, identifying which ones are used, which are outdated, and which are being replaced by manual alternatives. The second phase is definition — agreeing on KPI definitions, documenting field- level data standards, and identifying which business questions each report needs to answer. The third phase is build — redesigning saved searches, dashboards, and financial reports based on current business needs. The fourth phase is adoption — training users on new dashboards and reports. The fifth phase is governance — establishing a review cadence and a process for new report requests.
How to Prioritize Which Reports to Fix First
Prioritization should account for the frequency of manual preparation, the number of people affected, the criticality of the decisions the report supports, and the root cause complexity. Reports that are prepared weekly or monthly for leadership and require significant manual work should be addressed first. Reports that are broken because of data governance issues should not be rebuilt until the underlying data quality is addressed, or the problem will simply recur.
How Managed Services Can Help
A managed services partner brings both the NetSuite expertise to diagnose reporting problems and the ongoing engagement to sustain improvements over time. Point-in-time projects improve reporting temporarily. Sustained managed services ensure that reports stay aligned with business needs as processes change, that new report requests are evaluated and built efficiently, and that data governance practices are maintained rather than allowed to drift.
Client Spotlight
Recovering Month-End Close Speed Through Cost Engine Optimization
A growing technology company was experiencing progressively slower month-end close cycles. The root cause was NetSuite cost engine processing time, which had become a material bottleneck as transaction volume scaled. Finance leadership flagged the issue as a risk to reporting timelines and began evaluating options — uncertain whether the problem required a platform change or could be resolved through configuration work alone.
A targeted performance optimization engagement addressed cost engine configuration, data volume management, and processing sequence — requiring deep technical expertise in how NetSuite handles cost calculations at scale. The result was a materially faster close cycle that restored finance team confidence in the platform and eliminated the processing bottleneck that had been constraining month-end reporting speed as the business grew.
Industry: Technology | Outcome: Month-end close speed recovered; cost engine performance optimized at scale
Frequently Asked Questions
Why does NetSuite reporting still feel manual after implementation?
Manual reporting after implementation is almost always a symptom of underlying issues rather than a limitation of NetSuite itself. The system includes robust reporting tools — saved searches, financial reports, dashboards, KPI scorecards, and SuiteAnalytics workbooks — but those capabilities require configuration expertise and ongoing maintenance to remain aligned with how the business operates. When reports are built at go-live to satisfy initial requirements and never updated, when data entry practices diverge over time, or when key processes happen outside the system, manual reporting becomes the only way to get accurate answers.
What are the most common causes of manual NetSuite reporting?
The six most common causes are: inconsistent data entry practices that make reports unreliable because the underlying data cannot be trusted; unclear or undocumented KPI definitions that cause different departments to produce different numbers for the same metric; saved searches built at go-live that do not reflect current business needs; generic dashboards that show the same information to every role rather than surfaces what each role actually needs; key processes handled outside NetSuite that leave important data out of the ERP entirely; and reports built around outdated requirements that have not been updated as the business evolved.
How do saved searches work in NetSuite and why do they stop working over time?
Saved searches are NetSuite's primary reporting mechanism for transactional data. They query records in real time based on defined filters and return structured results that can be displayed on dashboards, exported, or used as data sources for other reports. Saved searches stop working accurately over time when the business evolves — new fields are added, item classes change, org structures shift, or revenue models change — and the saved search is not updated to reflect those changes. Regular review of key saved searches against current business requirements is a core part of reporting maintenance.
What should a role-based NetSuite dashboard include?
A CFO dashboard should lead with financial position — cash balance, accounts receivable aging, accounts payable obligations, and revenue against budget — and surface trends that require executive attention. An operations dashboard should show throughput, fulfillment status, backorder volume, and vendor performance, surfacing open purchase orders by expected receipt date and unfulfilled orders by age. A sales dashboard should show pipeline by stage and age, quota attainment by rep, and opportunities approaching close date. Each role requires a separate design conversation built around how that role actually makes decisions, not a one-size-fits-all layout.
How does data governance affect NetSuite reporting quality?
Data governance is the set of policies, standards, and practices that determine how data is entered, maintained, and used in the system. Without it, data entry practices diverge over time — users develop their own conventions, mandatory fields get bypassed, and new employees follow informal guidance that may contradict original standards. The result is a dataset that looks complete but produces inconsistent reports because similar transactions are recorded differently by different users. Strong data governance includes documented field-level entry standards, approval workflows that enforce data quality, and regular audits to identify and correct inconsistencies.
How long does a NetSuite reporting improvement project typically take?
A reporting improvement project follows a structured sequence: discovery to inventory all current reports and identify which ones require manual preparation and why; root cause analysis to determine whether the issue is configuration, data governance, process design, or training; design and build of improved saved searches, dashboards, and role-based layouts; governance structure to sustain reporting quality going forward. The timeline depends on the scope and root cause complexity, but most organizations begin seeing material improvements within six to twelve weeks of starting a focused reporting improvement engagement.
Can managed services fix NetSuite reporting problems on an ongoing basis?
A managed services partner provides both the NetSuite expertise to diagnose reporting problems and the sustained engagement to prevent them from returning. Point-in-time projects improve reporting temporarily, but without ongoing maintenance and governance, the same issues tend to re-emerge as the business evolves and data entry practices drift. inVESTED PRO from The Vested Group includes reporting infrastructure maintenance as part of the ongoing managed services model — reviewing and updating saved searches and dashboards as business needs change, enforcing data standards, and proactively identifying reporting gaps before they require manual workarounds.
Looking to Improve NetSuite Reporting?
The Vested Group helps companies identify the root causes of reporting friction, redesign saved searches and dashboards for real operational usefulness, establish data governance practices that improve report reliability, and build reporting workflows that reduce or eliminate manual preparation.
The Vested Group helps companies optimize reporting, dashboards, workflows, and NetSuite visibility through inVESTED PRO managed services. If your team still relies heavily on manual reporting, it may be time to evaluate the processes and governance behind the reports.

Jon Leander
Jon Leander is a Solution Architect at The Vested Group with more than 22 years of accounting and financial leadership experience, including over 9 years working with NetSuite. Drawing on his background as a controller, director of finance, NetSuite administrator, and application architect, Jon helps organizations optimize their ERP investment through strategic consulting, process improvement, and ongoing system enhancements. He specializes in financial management, revenue recognition, reporting and analytics, Procure to Pay (P2P), Order to Cash (O2C), Record to Report (R2R), SuiteAnalytics, and NetSuite integrations, helping clients improve operational efficiency and long-term business performance.